* This report was prepared in Jan 21, 2019.

Summary
Home Depot is an American home improvement supplies retailing company that sells tools, construction products, and services. It currently operates in the United States, Mexico, and Canada, managing over 2,000 stores as the largest retailer in the world.
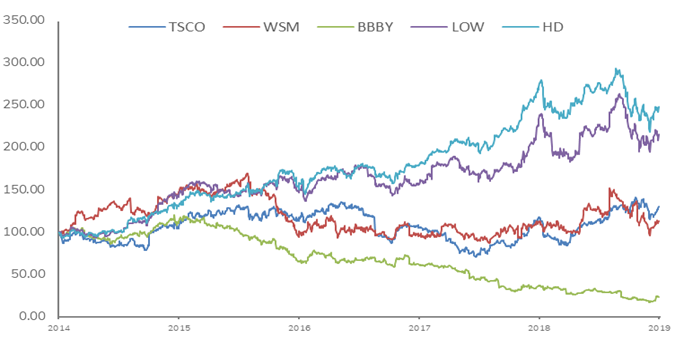
Today, the US home improvement market is de facto run by Home Depot (HD) and Lowe's (LOW) as duopoly. In contrast to early anxieties facing Amazon’s retail conquest, the home improvement market proved to be Amazon-proof, for the time being, due primarily to the moat created by the difficulty of delivering heavy and expensive materials and the importance of professional guidance.
Home Depot targets two primary customer groups identified as Do-It-Yourself (DIY) and Professionals (Pros). The company has been employing tailored services to better meet the differential needs, and the strategy is beginning to see positive results in terms of average ticket size. Moreover, the disciplined corporate strategies – share repurchases and cash dividends – are monotonically heightening the attractiveness to investors.
As “One Home Depot Supply Chain” and “Integrated Retail” (going-digital) initiatives set on a stable track, the company is expected to restore the temporarily impaired margins and obtain competitiveness against Amazon in the long game.
Combined with the mentioned strengths, the recent market-wide selloff and continued improvement in both macroeconomic and corporate fundamentals provide a good opportunity to go long on Home Depot.
Upside
Plus 1. Rising Demand for Home Renovation
According to National Association of Home Builders (NAHB), the average spending on home remodeling per household in 2017 was $6,148, a 6% increase growth compared to 2016. The market size for home renovation in US was $361 billion in 2016 and is expected to grow by 2% until 2025. As the primary drivers of the trend, the report names the increase in the share of baby boomer generation in the housing market and the rising interest in home renovations.
The company stated in explaining its sturdy performance despite the weak sentiment in the housing market that the ongoing interest rate hike is turning home owners’ eyes onto renovation instead of new home purchases. With current 30-year mortgage interest rate oscillating between 4.3-4.7%, the company expects the rate to hike up to mid-5% in 2019. Combined with the 40-year low unemployment rate and stable inflation rate, a steady growth in renovation demand may halfway compensate for the potential stagnation in housing market.
Plus 2. Integrated Retail & Supply Chain
In addition to a decade long initiative to build upstream supply chain infrastructure, Home Depot has undertaken large investments in downstream supply chain as part of “One Home Depot Supply Chain” initiative. The company aims at building efficient logistics system that delivers customer purchases in one to two days and reach up to 90% of US households. Along with the investment in digital portal, HD is aggressively adapting to the varying consumer demands and hence maintaining competitiveness. To date, cost associated with transportation and supply chain are impairing the margins; however, once the utilization of online platform and infrastructures ramp up, HD is expected to restore and potentially achieve healthier margins. Moreover, the firm’s two-track strategy – providing tailored services and product selections to DIY and Pro customers – are beginning to show positive results as integrated retail and supply chain strategies normalize. As a supporting fact, HD witnessed an improvement in Pros sale and an increase in average ticket size.

Plus 3. Growing Return on Invested Capital
Home Depot's executive compensation is tied to Return on Invested Capital (ROIC). The company targets 40% ROIC by 2020 and in fact is on track to achieve the target by the upcoming release. Through achieveing a steady ROIC growth, Home Depot is appropriately justifying the constantly growing debt balances. Note, however, that the ROIC purported in the financial statement is propritarily calculated measure and thus may require adjustments for robust evaluation.

Plus 4. Share Repurchase & Dividend Growth
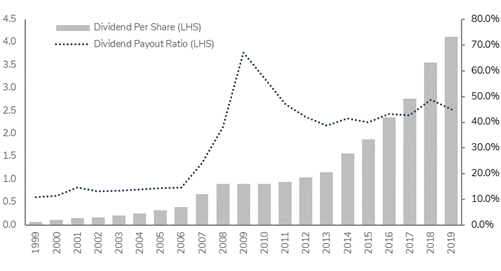
Home Depot is well-known for its operational efficiency. On par with its reputation, the company has been maintaining a stable growth in free cash flow (as shown in <Figure 3>), enabling an aggressive share repurchase and dividend programs. In the third quarter alone, the company repurchased 12.6 million shares for $2.5 billion and targeted buying $8 billion worth of shares by the end of 2018. As a result, diluted EPS will increase by approximately 25%, outpacing expected revenue and net income growth (YoY) of 4.6% and 22.3%.
Downside
Risk 1. Lowe's and the New CEO
Marvin Ellison, former CEO of J.C. Penny and an executive of Home Depot, joined Lowe’s as CEO on July 2, 2018. He has track record of spearheading turnarounds and recovering lost profitability. In line with his reputation, he immediately undertook aggressive measures upon assuming his role, proposing to close 51 underperforming stores and instead hiring 65,000 new employees. Although Home Depot may continue to lead the home improvement and appliance market, Lowe’s with the new management may pose threats to Home Depot’s market share and stock performances as it enters into a multi-year turnaround, which will also greatly appeal to the investors that see a significant room for improvement.
Risk 2. Debt, Book Value & EPS Growth Slowdown
Home Depot has been aggressively buying back shares at cost of book value (Figure 4). The current equity to debt outstanding is deemed highly levered. For the time being, Home Depot has enough buffers to accommodate the liabilities and aggressive corporate strategies. The operating cash to debt ratio is roughly 58.96% (lower if other obligations are included), short-term debt’s weighted average interest rate is 1.45% (much lower than the cost of equity, ~2.4%), and long-term debts are well dispersed across time. But it is certain that HD’s corporate strategy is not sustainable at current rate. Given the exhaustion in the equity balance, in coming years, HD is likely to experience a slowdown in EPS growth.

Risk 3. Housing Market Sentiment
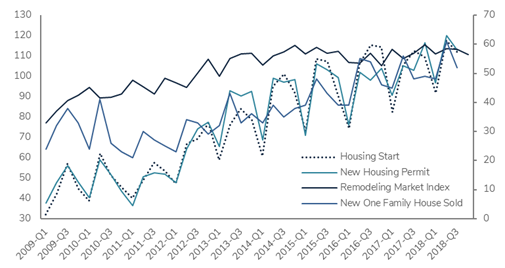
Home Depot’s greatest vulnerability is its sensitivity to the US housing market. On a linear regression basis, historical year over year changes in Housing New Start index and Home Depot’s share prices report an elasticity of 0.68 or 0.68% change in share price per 1% change in the index. The story is similar for other housing market indicators. However, as discussed in Plus 1., current level of employment, affordable interest rate, and postivie M2 growth suggest strong narrative for continued real estate price stability.
Dividend Analysis
In addition to the repurchase programs, Home Depot has been a never-slipper when it comes to dividend – even during the hardest time during the 2008 financial crisis, HD managed to hold its dividend constant. This provides a solid ground to evaluate the corporate performance using dividend, assuming other operational aspects are maintained on similar levels.
In dollar terms, Home Depot has outpaced Lowe’s since 2001 and demonstrates a faster growth in the recent years. In attempts to compare dividend growth with more robustness, the dividend growth regression model was taken to project future normalized dividends. For normalization, the dividends were multiplied by the normalization factor (0.5569) that indexes closing prices on January 20th ($179.58) to 100. To incorporate both cases of exponential and arithmetic growth, two model specifications – linear and exponential – were used. The normalized the dividends were then regressed against time, and the fitted values for the subsequent periods were acquired.
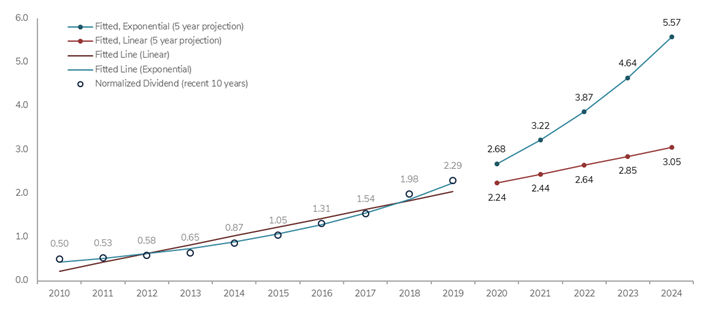
<Figure 7> traces the results: normalized dividends (FY 2010-2019) and the fitted values (2020-2024). The exponential model estimated the annual growth rate to be 20.1%, whereas the linear model estimated 202 basis point increase per year. While the exponential model provides excellent fit to the recent track of dividends, such high growth rate is unlikely to be sustained over extended period. Acknowledging the limitations, the models expect the dividend yield in 2024 (had one purchased a share in January 20th) to fall between 3.05% and 5.57%. The same tests on Lowe's (LOW) dividends estimated the dividend yield to fall between 2.62% and 4.97%, which are marginally lower than the projections for Home Depot.
Disclosure: I have no positions in any stocks mentioned, and no plans to initiate any positions within the next 72 hours. I wrote this article myself, and it expresses my own opinions. I am not receiving compensation for it. I have no business relationship with any company whose stock is mentioned in this article.
JWH 05/27/2020
