【Financial Modeling】Consulting Case : Restaurant (0)
Background In 2018, I received a call from a friend who started a restuarant business funded primarily by a single private investor. My friend was awaiting the next phase of seed fund from the inve..
quant-curiosity.tistory.com
The first step was to review how the sales accounts were being handled. When I first received the ways he dealt with POS (Point of Sale) data was as shown below:
Daily Sales
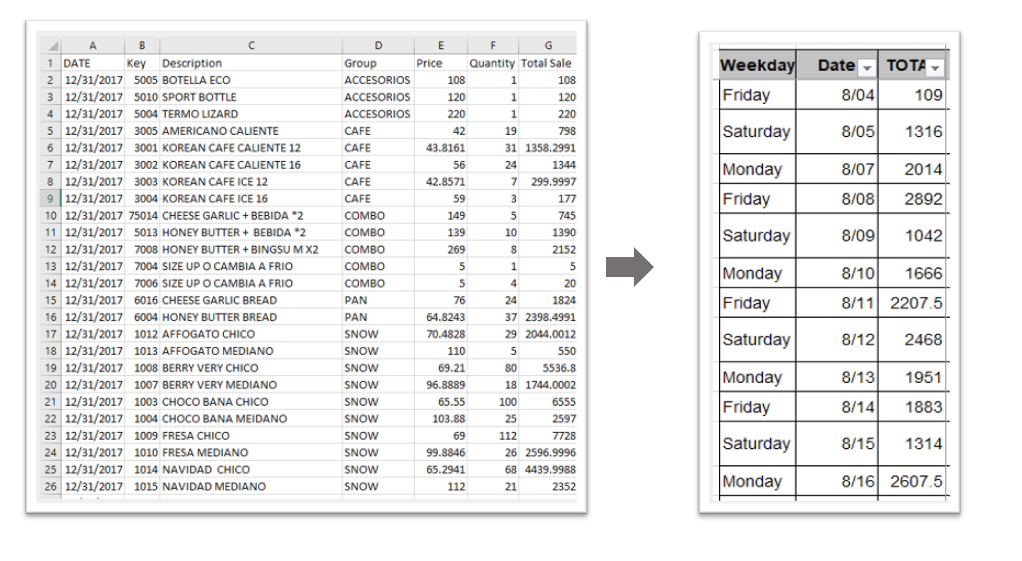
On the left is the transaction-level data provided by the POS system. On the right is how my friend aggregated the daily sales. This table did not contain sufficient information.
Hourly Sales
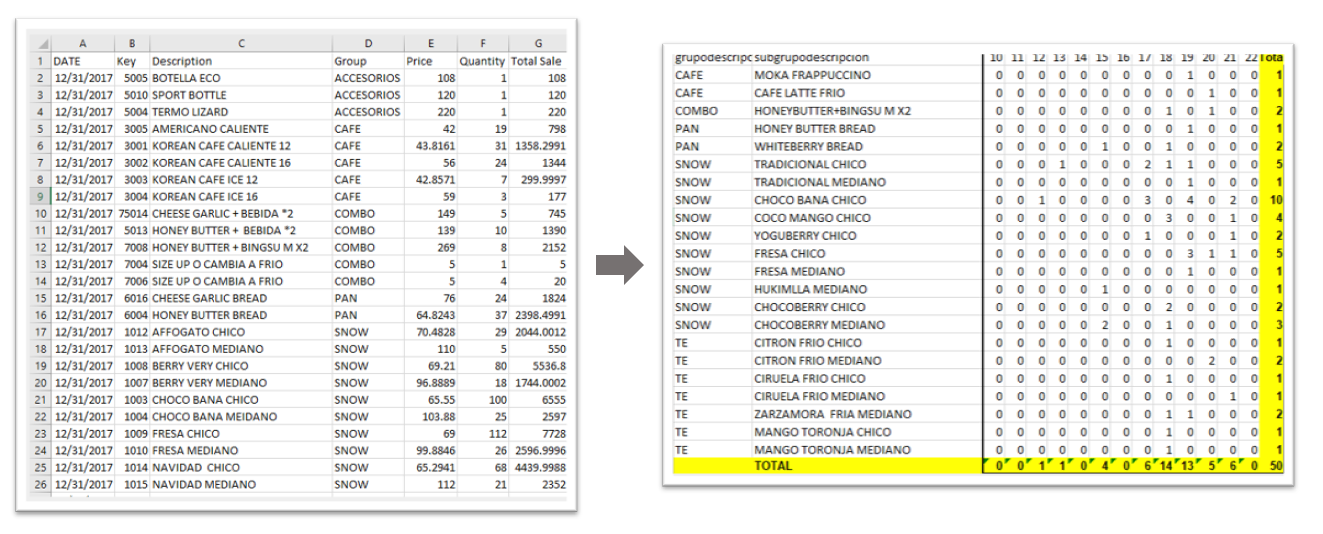
This transaction data was also being used to create a table long by [Product] and wide by [Hour of Sales]. The identical table was created for both sales amount and counts for every operating day. This workbook was (1) massive and (2) extreme inefficient.
The goal of this workbook was to track the hourly sales of each product and to check whether the daily temperature impacted the sales (based on my friend's observation that the restaurant had higher sales on the hotter days). We will discuss how this was prepared in the next post.
Problem
The major problems were:
- No accounting is done
- Sole focus on sales, not cost or margin
- No sustainable methods of analyzing sales or performance
- No visualization to offer to the investor
Action 1. Accounting & Financial Reporting Template
The first step was performing proper retroactive accounting with a goal of providing the investor with appropriate information about the business performance and growth.
To refrain from exposing unnecessary level of information, most of these sample photos will remain blank.
Income Statement

In the order of ordinary income statement, we started from [Sales] > [SG&A] > [Gross Profit].

Then, [Operating Income/Costs] > [Other Income/Costs] > [Net Profit].
These accounts were calculated at [Monthly] > [Quarterly] > [Annual] levels in order to help the investor comprehend with the performance.
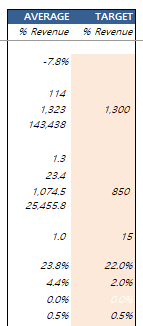
We also prepared average metrics and target values as % of revenue for the coming periods.
Simple Earning Projections
Because the busienss was relatively new (a bit over a year old), there wasn't much basis to set up robust parameters for projections. Hence, we came up with a set of historical average-based parameters to generate Base case scenario quarterly projection.
The assumptions included:
- Ramp Up Period: 8 quarters
- Sales QoQ (%): quarterly QoQ growth starting from 5% down to terminal growth rate 1% by 0.5% decline per quarter
- Costs: average % of revenue, 6-month trailing.
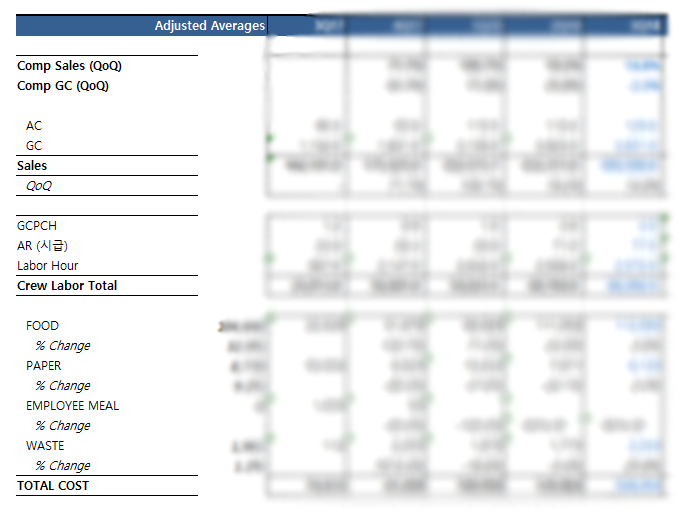
By preparing this template, we were able to spot that recent rent cost increase was impairing operating margin, despite a strong growth in sales. Additionally, it became possible to easily compare which aspect (account) other than sales and wage is deviating from the plan. Most importantly, we now had a presentable document to show recent developments in the business.
In the next post, we will discuss how we resolved:
- No sustainable methods of analyzing sales or performance
- No visualization to offer to the investor
'Analysis > Consulting & Financial Modeling' 카테고리의 다른 글
| 【Consulting Case】Restaurant (4) : Breakdown by Periods (0) | 2020.07.14 |
|---|---|
| 【Consulting Case】Restaurant (3) : Monthly Snapshot (0) | 2020.07.14 |
| 【Consulting Case】Restaurant (2) : Exploratory Analysis (0) | 2020.07.13 |
| 【Consulting Case】Restaurant (0) : Background (0) | 2020.07.12 |
